Sparking children's curiosity with infographic books
Published on: 15 November 2023
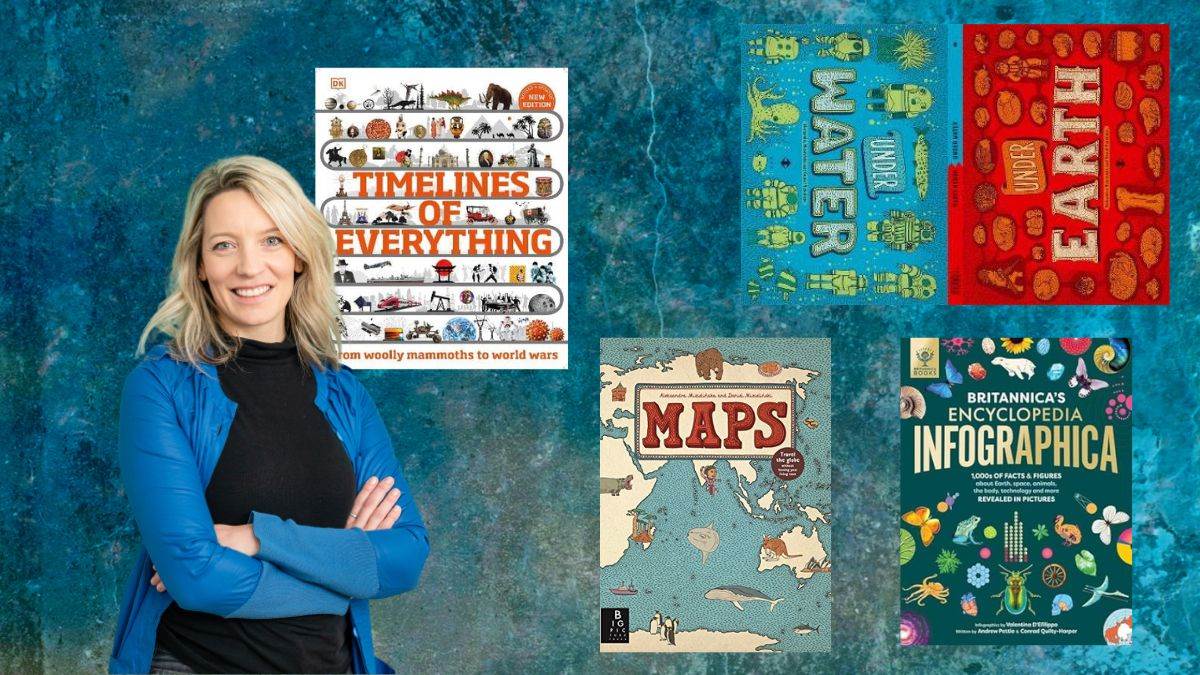
Author and illustrator Valentina D’Efilippo explains how infographics inspire a love for learning and exploration in children.
In today’s digital age, finding effective ways to engage children in reading and keep them away from screens is crucial. However, reading can sometimes feel like a chore, especially when it comes to non-fiction books. Fortunately, there is one genre that has proven to be exceptionally captivating for young readers – infographic books. With visually appealing layouts and bite-sized facts, these books have become a gateway to a world of knowledge, transforming reading and learning into an enjoyable activity.
Did you know that around 70% of the way our brain perceives the world is visual? Infographic books tap into this visual nature of our brain, presenting information in a visually stimulating manner. Instead of overwhelming readers with long text, these books utilise eye-catching graphics, vibrant colours and concise snippets of information. This combination not only captures children’s attention but also makes complex topics more accessible and digestible.
The visual nature of infographics also enhances creativity by allowing children to imagine and visualise concepts in new and exciting ways. Infographics have a unique power to foster creativity and critical thinking skills, teaching children to interpret data in a meaningful way. They learn to analyse, compare and draw conclusions while having fun.
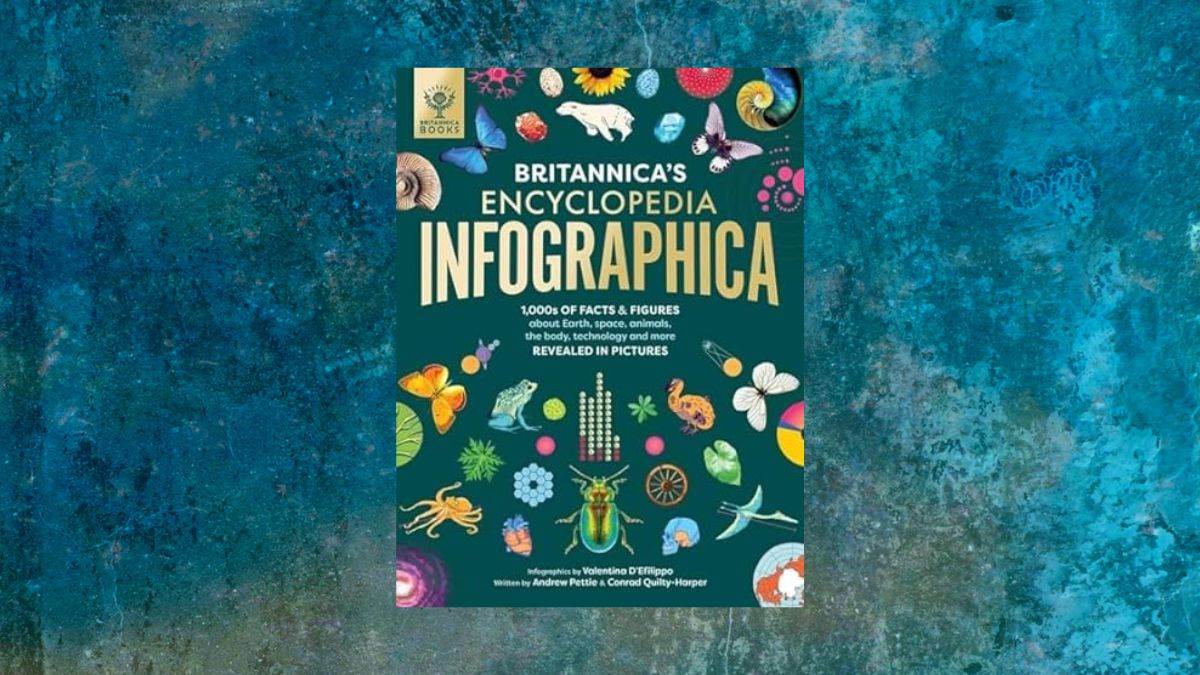
As an illustrator of infographics, I recently applied my experience as a data designer to the world of children’s books. The result was the creation of Britannica’s Encyclopedia Infographica: a one-of-a-kind encyclopedia that offers a refreshing alternative to traditional learning methods. Through captivating visual storytelling, including infographics, maps, charts and timelines, we transformed statistics into meaningful stories that children can relate to and explore. They can learn about space, Earth, animals, humans and technology. There are facts about the strongest animals to the biggest creatures; the distribution of water on our planet; deadly creatures and natural disasters; extreme altitudes and depths, the magnitude of manmade structures, the speeds of the fastest vehicles; as well as how many cups of snot your body makes a day!
Infographic books may seem like a trendy new concept, but they actually have a rich history. One example from the past is the iconic Visual Explanation series by Maria Neurath. She transformed complex topics into accessible and visually stunning narratives using innovative techniques such as pictograms and simplified illustrations. Neurath’s legacy has informed my work in transforming data and complexity into accessible visual stories.
During my research for Britannica’s Encyclopedia Infographica, I came across some incredible infographic books that captured my imagination. One such gem is The Book of Comparisons: Sizing up the world around you by Clive Gifford and Paul Boston. This stunning book combines interesting statistics with clever visuals that transform numbers into meaningful stories. It compares a huge variety of different subjects, absorbing readers with entertaining and surprising information.
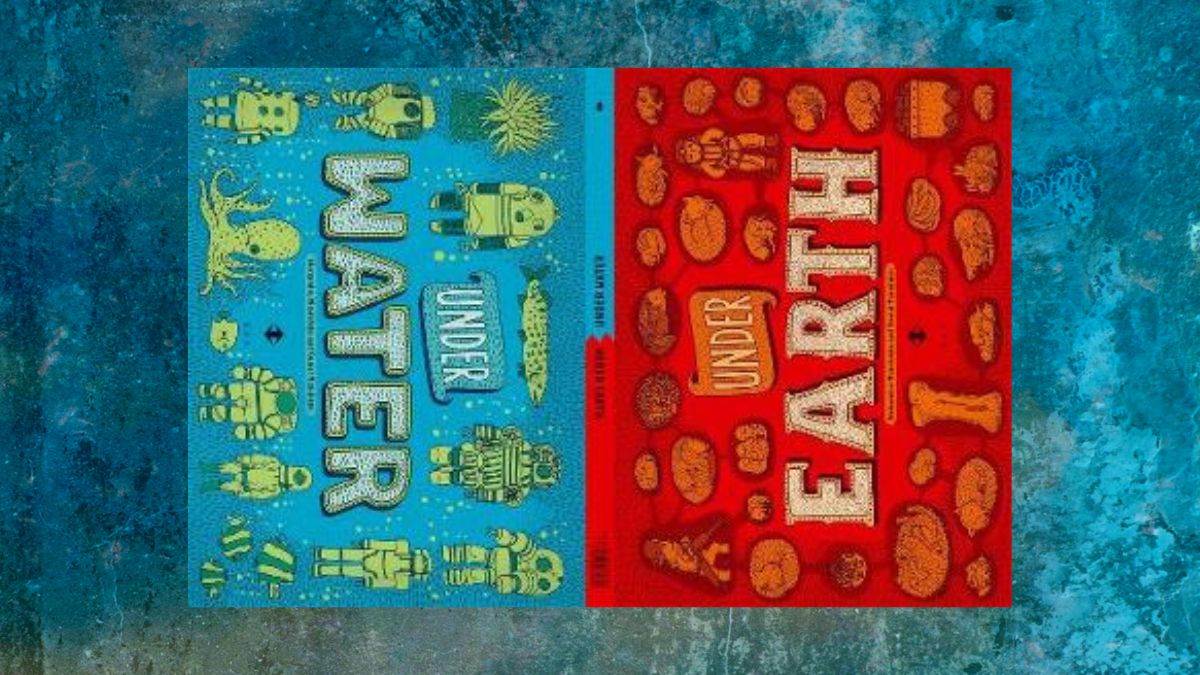
Another book that I absolutely love is Under Earth, Under Water by Aleksandra and Daniel Mizielinski. With its large and experimental format, gorgeous design and quirky illustrations, readers can dive deep below the surface and discover what happens under the earth and under the water. From early submarines and deep-sea life to burrowing animals and man-made tunnels, this book offers a fascinating exploration.
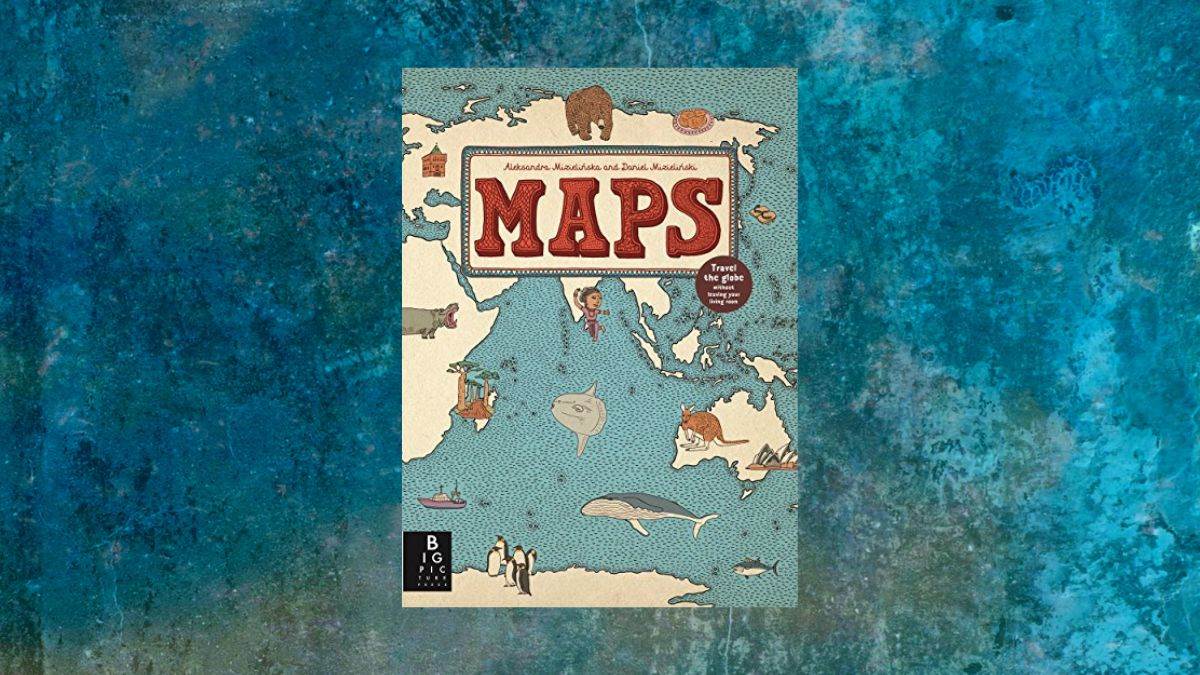
The same creative duo is also behind the bestselling Maps–a collection of 52 beautifully illustrated maps that detail not only geographical features and political borders but also places of interest, iconic personalities, native animals and plants, local peoples, cultural events and many more fascinating facts associated with each region.
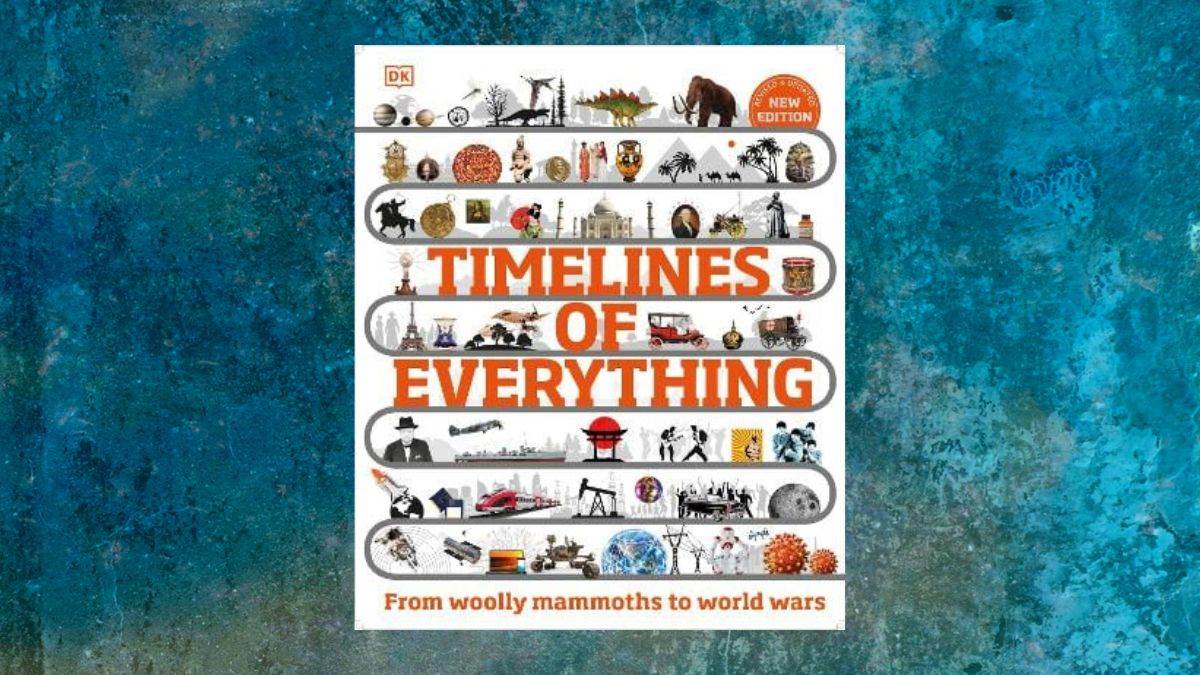
Another captivating find is Timelines of Everything: From Woolly Mammoths to World Wars, published by DK. This book takes readers on a journey through time, exploring significant events in history through visual timelines. It’s a fantastic resource for children and adults alike. Its chronological structure, with six chapters covering Prehistory, the Ancient World, the Medieval World, the Age of Exploration, the Age of Revolution, and the Modern World helps readers develop a deeper understanding of how the world has evolved.
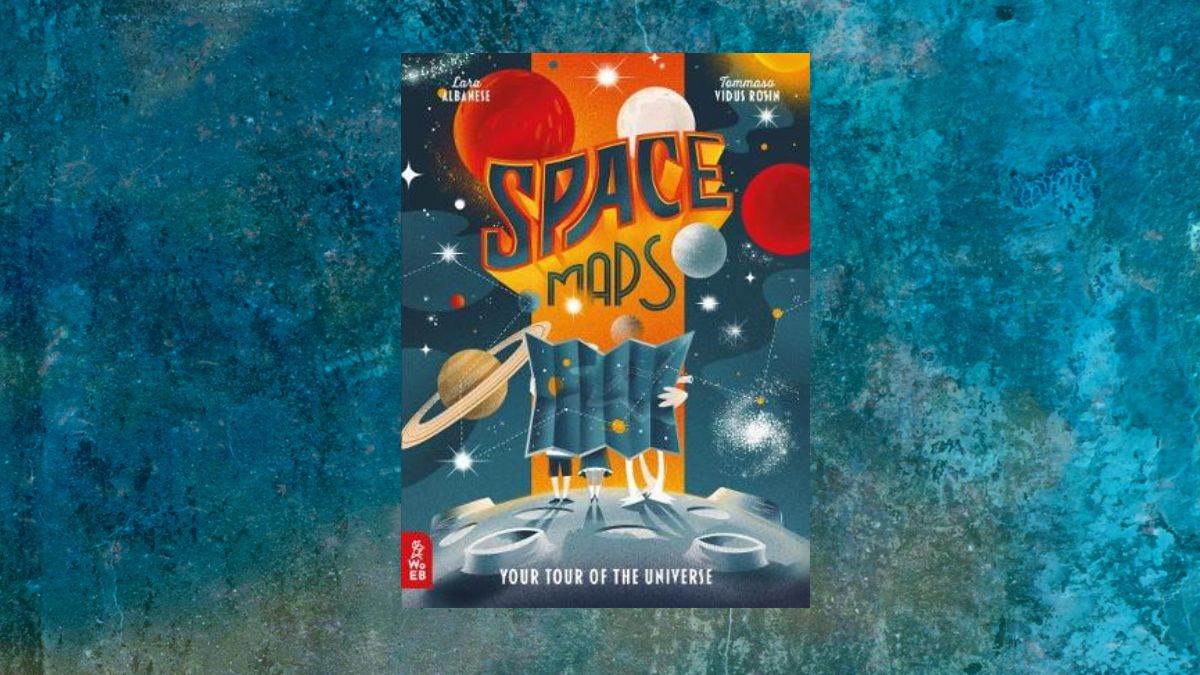
Finally, Space Maps by Lara Albanese and Tommaso Vidus Rosin is an astronomical delight. This super-sized book of maps and beautiful illustrations of mind-boggling facts about the universe takes readers on a space adventure from the stars to the solar system, and far beyond!
These excellent examples are, in my opinion, a testament to the power of data visualisation and non-fiction storytelling in sparking curiosity not only in children but also in adults. These books can offer valuable benefits for both parents and educators. For parents, these books provide an opportunity to bond with their children over shared interests and engage in meaningful conversations about various topics. Moreover, by introducing children to the wonders of non-fiction reading at an early age, parents can lay a strong foundation for lifelong learning. Educators, on the other hand, can leverage infographic books as powerful teaching tools. Incorporating infographics into lesson plans can make teaching more interactive and creative – enhancing students’ critical and analytical thinking skills.
Britannica's Encyclopedia Infographica,with infographics by Valentina D’Efilippo and written by Andrew Pettie and Conrad Quilty-Harper, is out now.
Topics: Features


